A route optimization proposal can show an impressive return and still be wrong.
The most common problem is not the formula. It is counting the same operational improvement more than once.
For example, reducing route planning time may release dispatcher capacity. If that capacity is counted as labor savings and then counted again as additional delivery capacity, the calculation overstates the result unless both outcomes genuinely occur.
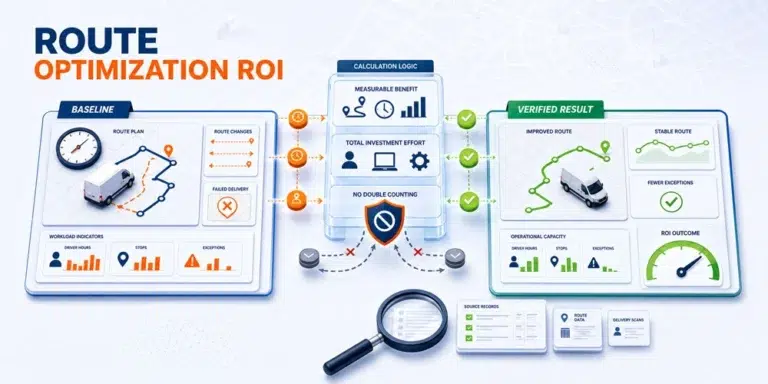
A credible route optimization ROI analysis must connect each claimed benefit to a measurable operational change, assign clear ownership to the data, and separate released capacity from actual financial impact.
This guide provides a practical model for building that analysis without relying on generic vendor promises, unsupported industry benchmarks, or assumed software prices.
For an explanation of the technology and constraints behind route creation, read our route optimization software guide.
What Route Optimization ROI Should Measure
Return on investment compares the measurable value created by a project with the total resources required to implement and operate it.
The basic formula is:
ROI (%) = ((Total Measurable Benefit − Total Investment) ÷ Total Investment) × 100
The Business Development Bank of Canada’s ROI overview explains ROI as a financial ratio used to assess the return generated by an investment. For a route-planning project, the important step is defining which measurable benefits and investment inputs belong in that calculation.
A related measure is the payback period:
Payback Period = Total Investment ÷ Average Monthly Measurable Benefit
These formulas are simple. Building reliable inputs is the difficult part.
A route planning project may affect:
- Route preparation time
- Dispatcher workload
- Planned travel
- Driver hours
- Vehicle use
- Delivery capacity
- Route stability
- Time window compliance
- Failed delivery attempts
- Customer service workload
- Overtime
- Completion documentation
Not every improvement should automatically be converted into financial value.
Some changes release capacity without reducing an expense. Others improve service quality but do not produce an immediate financial return. A transparent analysis should distinguish among these outcomes.
Start With a Baseline, Not a Benefit Estimate
A route optimization ROI calculation needs a reliable description of current performance before any improvement is claimed.
A defensible route optimization ROI model should preserve that baseline so every claimed result can be compared with the operation’s documented starting point.
Choose a representative baseline period. Avoid using an unusually busy week, a severe weather event, or a period when the fleet was operating below normal capacity.
The baseline should cover enough time to show normal variation in:
- Order volume
- Route count
- Stops per route
- Service areas
- Driver availability
- Customer windows
- Delivery complexity
- Failed attempts
- Planning workload
Record the current values before changing the process.
| Baseline measure | What to record | Possible data owner |
|---|---|---|
| Route preparation | Planner hours per day or week | Dispatch manager |
| Route volume | Routes prepared | Operations |
| Delivery volume | Stops assigned and completed | Delivery system |
| Planned travel | Expected route time or distance | Route records |
| Actual travel | Driver or vehicle records | Fleet operations |
| Route changes | Adjustments after approval | Dispatch |
| Failed attempts | Incomplete deliveries by reason | Customer service |
| Time window compliance | Deliveries within commitment | Operations |
| Overtime | Approved overtime related to delivery work | Payroll |
| Customer contacts | Calls or messages related to delays | Customer service |
The objective is not to collect every available metric. It is to identify the measures most likely to change because of route optimization.
Define the Business Objective Before the Formula
Two companies may implement the same type of software for different reasons.
One may need to prepare routes more quickly. Another may need to increase delivery capacity without immediately adding more vehicles. A third may be trying to protect customer time windows or reduce repeated manual adjustments.
A useful ROI model begins with one primary objective.
Examples include:
- Reduce routine route preparation time
- Increase stops completed with the current operating resources
- Reduce avoidable route changes after release
- Improve workload balance between drivers
- Lower failed attempts caused by planning errors
- Improve compliance with accepted delivery windows
Secondary improvements can still be measured, but the primary objective gives the analysis a clear decision standard.
Without that priority, the model may collect many small benefits that look impressive together but do not resolve the operational problem that justified the project.
The Five Parts of a Route Optimization ROI Model
A practical route optimization ROI model should contain five separate sections.
1. Total Investment
Use the actual information available to your business. Do not estimate a vendor’s pricing from another company, an old article, or an unrelated implementation.
Investment may include:
- The actual software commitment provided to your company
- Setup and configuration effort
- Data preparation
- Integration work
- Internal project time
- Dispatcher and driver training
- Process documentation
- Testing
- Ongoing administration
- Internal support
Some inputs are direct expenses. Others are internal time commitments that can be valued using the company’s approved method.
Keeping them visible prevents the ROI model from treating implementation as effortless.
2. Direct Measurable Benefits
Direct benefits create an identifiable financial effect.
Depending on the operation, these may include:
- Overtime that is actually reduced
- Temporary planning labor no longer required
- Avoided external routing work
- Fewer repeated delivery attempts
- Reduced vehicle use when a vehicle is genuinely removed from service
- Avoided additional operating resources that were already planned
A benefit should enter this section only when the company can explain how the operational improvement changes an actual expense or avoids a documented future requirement.
3. Released Operational Capacity
Released capacity is valuable, but it is not automatically a saving.
Examples include:
- Dispatcher hours made available for other work
- Driver time available for additional stops
- Vehicle capacity available for more orders
- Faster route preparation before release
- Fewer customer service contacts
- Less time spent finding delivery records
The organization must decide what happens to that capacity.
If the released hours are used to process more deliveries, the benefit may appear as additional throughput. If the same workload and staffing continue unchanged, the improvement is operational capacity rather than direct financial return.
Both outcomes matter, but they should not be labeled as the same thing.
4. Service and Risk Improvements
Some outcomes are strategically useful even when they are difficult to convert into a precise financial figure.
These may include:
- More consistent customer windows
- Better driver workload balance
- Earlier identification of difficult routes
- Less dependence on one experienced planner
- Stronger process consistency
- Better visibility into route decisions
- More reliable completion records
Report these separately.
Forcing every improvement into a monetary value can make the model less credible, particularly when the organization has no evidence connecting the service improvement to revenue or expense.
5. Ongoing Measurement
ROI should not be calculated once and forgotten. Actual route optimization ROI should be reviewed after adoption stabilizes and compared with the original assumptions, implementation effort, and operating baseline.
The model should identify:
- Which metric will be monitored
- Where the data comes from
- Who owns the metric
- How frequently it is reviewed
- Which baseline is used
- What target was approved
- Which outside factors may affect the result
This turns the proposal into a measurement plan rather than a collection of assumptions.
A Practical Route Planning ROI Worksheet
Use the following structure to prepare the business case.
| Category | Baseline | Expected change | Measurement source | Financial treatment |
|---|---|---|---|---|
| Route preparation time | Current planner hours | Hours released | Dispatch records | Capacity or direct benefit |
| Route changes after release | Current changes per route | Reduction | Route history | Operational measure |
| Driver overtime | Current overtime hours | Actual reduction | Payroll | Direct benefit |
| Completed stops | Current stops per operating period | Additional completions | Delivery records | Capacity or measurable benefit |
| Failed delivery attempts | Current preventable failures | Reduction | Failure reason codes | Direct benefit when documented |
| Customer service contacts | Current route related contacts | Reduction | Support records | Capacity |
| Time window compliance | Current compliance rate | Improvement | Delivery timestamps | Service measure |
| Vehicle requirement | Current vehicles used | Verified change | Fleet records | Direct benefit only when realized |
Do not complete the Financial Treatment column until the business agrees on what will happen operationally.
That single step can prevent released capacity from being presented as guaranteed savings.
A Hypothetical Operational Example
The following scenario is hypothetical and does not represent an It’s Here customer or an industry benchmark.
A regional delivery business compares two eight week periods with similar order volume and service areas.
Before the route planning change:
- Planners spend 40 hours per week preparing and correcting routes
- Active routes require 18 manual changes per week
- Drivers record 12 hours of route related overtime per week
- Ten delivery attempts per week fail for reasons connected to planning or missing route information
After implementation:
- Planning requires 26 hours per week
- Active routes require 11 manual changes per week
- Route related overtime falls to eight hours per week
- Planning related failed attempts fall to seven per week
The company should not immediately add every difference into the ROI total.
First, classify the changes:
| Improvement | Classification question |
|---|---|
| 14 planning hours released | Were expenses reduced, or was capacity reassigned? |
| 7 fewer route changes | Did this reduce overtime, customer contacts, or only disruption? |
| 4 fewer overtime hours | Does payroll confirm that the reduction occurred? |
| 3 fewer failed attempts | What documented resources were avoided for each attempt? |
The company can then apply its own verified labor, vehicle, redelivery, and administrative values.
No external benchmark or assumed vendor price is needed.
Prevent Double Counting
Double counting is one of the biggest threats to a reliable delivery route optimization ROI analysis.
Planning Time and Labor Savings
If planners save 14 hours but remain employed for the same total hours, the result is released capacity.
Do not report the full value as a labor saving unless labor expense actually changes.
Driver Time and Additional Capacity
If a route releases driver time, decide whether the benefit is lower overtime or additional stops.
Counting both may be valid only if records show that overtime decreased and additional delivery output increased independently.
Fewer Failed Attempts and Lower Driver Hours
The avoided failed attempt may already include driver time, vehicle use, and administrative work.
Do not add each component again if they are included in one combined redelivery value.
Better Routes and Reduced Customer Contacts
Fewer route problems may reduce customer calls. If customer service capacity is counted separately, confirm that it is not already included in a broader administrative saving.
Every benefit should have one owner and one calculation path.
Use Conservative Assumptions
A strong route optimization ROI model does not depend on the most optimistic scenario.
Create three cases:
| Scenario | Purpose |
|---|---|
| Conservative | Uses modest improvement and full implementation effort |
| Expected | Uses the most supportable operational assumptions |
| Stretch | Shows the result if adoption and data quality are stronger than expected |
The decision should remain reasonable under the conservative or expected case.
If the proposal works only when every possible benefit reaches its highest estimate, the model needs more evidence.
Apply the same caution to implementation speed. Route planning improvements may take time while teams clean order data, document constraints, train users, and refine planning rules.
Measure Adoption Alongside Performance
Software cannot improve routes when teams continue building the real plan outside the system.
Track adoption indicators such as:
- Percentage of eligible orders included in the route workflow
- Percentage of routes prepared through the approved process
- Manual changes made before release
- Manual changes made after release
- Orders missing required route information
- Drivers using the intended execution workflow
- Completion records captured consistently
Low adoption can make a capable tool appear ineffective.
At the same time, high adoption does not prove that the process is successful. Adoption and performance should be reviewed together.
How It’s Here Supports Measurable Route Operations
It’s Here documents both manual and automated route optimization, allowing teams to prepare routes through automation and apply dispatcher adjustments when operational context requires them.
The wider delivery management software workflow also includes:
- Multiple draft routes
- Driver route plans
- Real time shipment and driver visibility
- Current delivery statuses
- Live ETA information
- Order history
- Photo and signature proof of delivery
These capabilities can provide operational records for comparing planned routes with actual execution.
They do not guarantee a specific return. The measured outcome depends on data quality, workflow adoption, operating rules, and what the organization does with any capacity released by the new process.
When to Review the ROI Model
Review the model at defined stages.
Before Implementation
Confirm the baseline, objectives, assumptions, data owners, and investment categories.
After Initial Adoption
Check whether the intended users and orders are moving through the new process.
After a Representative Operating Period
Compare results against a similar baseline period.
After Major Operational Changes
Recalculate when order volume, service areas, fleet structure, customer windows, or delivery services change significantly.
A model based on an earlier operating environment may no longer represent the current business.
Making the ROI Decision With Defensible Inputs
A credible route optimization ROI calculation begins with operational evidence rather than a promised percentage.
Establish a representative baseline. Define one primary objective. Separate direct financial benefits from released capacity and service improvements. Include the complete implementation effort. Use conservative assumptions, and make sure each benefit is counted only once.
The formula is the final step, not the first.
The real work is proving how route planning changes daily operations and determining whether those changes create a measurable return for the business.
FAQ
How Do You Calculate Route Optimization ROI?
Subtract the total investment from the total measurable benefit, divide the result by the total investment, and multiply by 100. The quality of the result depends on using verified baseline data and avoiding double counting.
What Should Be Included in a Route Planning ROI Baseline?
Include route preparation time, route volume, delivery volume, route changes, driver overtime, failed attempts, time window compliance, and any other metric directly connected to the project objective.
Is Released Planner Time a Financial Saving?
Not automatically. It is released capacity unless the company reduces an expense, avoids a documented future requirement, or uses the time to create another measurable benefit.
How Long Should a Route Optimization ROI Review Period Be?
Use a period long enough to represent normal order volume and operational variation. Compare similar periods and account for seasonal demand, service area changes, and unusual events.
Can Better Customer Experience Be Included in ROI?
It can be reported as a service improvement. Convert it into a financial benefit only when the company has evidence connecting the improvement to a measurable revenue or expense outcome.